🔧 SQL for DevOps — Queries You'll Actually Run in Production
⏱️ 10–12 min read · 🎯 Intermediate · 📚 Part 15 of 20 👉 Missed Part 14? SQL Basics — SELECT, INSERT, UPDATE, DELETE & JOINs
🤔 A Different Kind of SQL Question
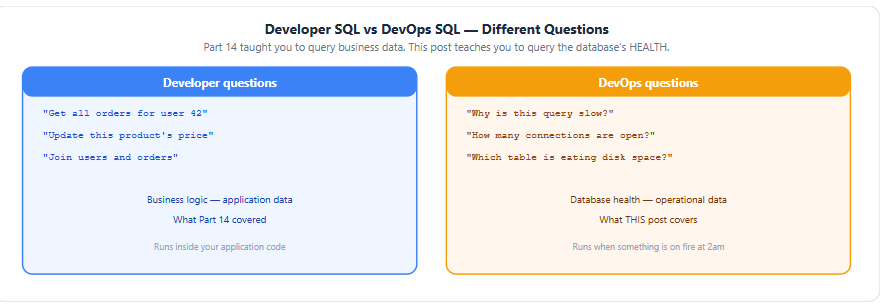
Part 14 taught you SQL to work with business data — orders, users, products. This post is different. These are the queries you run at 2am when the app is slow, the database is full, or someone is asking "why is production down?"
Developer SQL questions vs DevOps SQL questions
These queries do not touch your application data. They query the database's own internal statistics — how big each table is, which queries are slow, how many connections are open right now.
💾 Which Table Is Eating Your Disk?
Your RDS storage alert just fired. Before scaling up storage (which costs money), find out which table is actually growing.
Table size query with real result showing the culprit table
SELECT relname AS table_name,
       pg_size_pretty(pg_total_relation_size(relid)) AS total_size
FROM pg_catalog.pg_statio_user_tables
ORDER BY pg_total_relation_size(relid) DESC;
 table_name    | total_size
----------------+------------
 order_events   | 4.2 GB     ← the culprit
 users          | 45 MB
 products       | 12 MB
pg_total_relation_size() includes the table data plus all its indexes. pg_size_pretty() just formats the raw byte count into something readable (GB, MB) instead of a huge number.
Real scenario: An order_events table logging every state change on every order, with no cleanup policy, will silently grow forever. This query is how you catch it before your storage bill — or your storage limit — becomes a problem.
🐌 Finding Slow Queries — pg_stat_statements
Your app feels sluggish. Users are complaining about slow page loads. Instead of guessing, find out exactly which query is the bottleneck.
Slow query detection using pg_stat_statements with real result
-- pg_stat_statements is enabled by default on AWS RDS
SELECT query, calls, mean_exec_time, total_exec_time
FROM pg_stat_statements
ORDER BY mean_exec_time DESC
LIMIT 5;
 query                              | calls  | mean_exec_time
-------------------------------------+--------+----------------
 SELECT * FROM orders WHERE...      | 18,420 | 840 ms ⚠️
 SELECT * FROM users WHERE email... | 52,100 | 12 ms
This tells you two critical things: calls (how often this query runs — 18,420 times means it is hit constantly) and mean_exec_time (how slow it is on average — 840ms is very slow for a single query). A query that is both frequent AND slow is your top priority to fix.
-- Enable the extension if it's not already active (one-time setup)
CREATE EXTENSION IF NOT EXISTS pg_stat_statements;

-- Reset the stats to start fresh tracking (useful after a fix)
SELECT pg_stat_statements_reset();
🔌 Checking Connection Counts — pg_stat_activity
Your app is throwing FATAL: too many connections errors. This query shows you exactly who is connected and what they are doing right now.
Connection monitoring with pg_stat_activity — active connections and killing hung queries
-- See every active (non-idle) connection right now
SELECT pid, usename, application_name, state, query
FROM pg_stat_activity
WHERE state != 'idle';

-- Just the count, grouped by state — a fast health check
SELECT state, COUNT(*) FROM pg_stat_activity GROUP BY state;
 state  | count
--------+-------
 active | 8
 idle   | 47
If you see a huge number of idle connections, that usually means your application is not closing database connections properly — a classic connection pool leak. If you see many active connections stuck for a long time, something is holding a lock or running a slow query.
Killing a hung query — use this carefully, only when you have confirmed the query is genuinely stuck:
-- Find the problematic pid from the query above, then:
SELECT pg_terminate_backend(pid);
-- pg_terminate_backend forcibly ends that connection
🔬 EXPLAIN ANALYZE — Seeing Exactly How the Database Runs Your Query
This is the single most useful command for understanding why a specific query is slow. Prefix any query with EXPLAIN ANALYZE and PostgreSQL shows you exactly how it plans to execute it — and how long each step actually took.
EXPLAIN ANALYZE output before and after adding an index
EXPLAIN ANALYZE SELECT * FROM orders WHERE user_id = 42;
Without an index — a Sequential Scan:
Seq Scan on orders
  Filter: (user_id = 42)
  Rows Removed by Filter: 499998
Execution Time: 840.221 ms
Seq Scan means PostgreSQL checked every single row in the table, one by one, to find matches. Rows Removed by Filter: 499998 confirms it scanned half a million rows just to find 2 matching ones.
With an index — an Index Scan:
Index Scan using idx_orders_user_id
  Index Cond: (user_id = 42)
  Rows: 2
Execution Time: 0.089 ms
Index Scan means PostgreSQL jumped straight to the matching rows without checking anything else. The execution time drops from 840ms to 0.089ms — roughly 9,000 times faster.
📇 Why Indexes Fix This — The Book Index Analogy
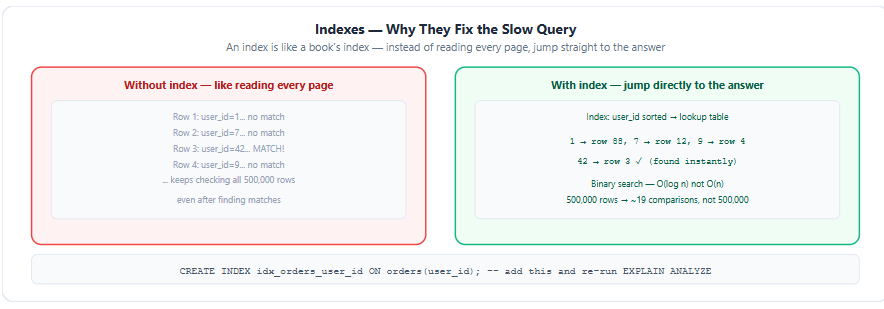
An index in a database works exactly like the index at the back of a book. Without it, finding a topic means reading every page. With it, you look up the topic and jump straight to the right page.
Index basics — without index scans every row, with index jumps directly
-- Create the index that fixes the slow query above
CREATE INDEX idx_orders_user_id ON orders(user_id);

-- Re-run the same EXPLAIN ANALYZE and compare
EXPLAIN ANALYZE SELECT * FROM orders WHERE user_id = 42;
When should you add an index? Any column you frequently use in a WHERE clause, a JOIN condition, or an ORDER BY is a strong candidate. Foreign key columns like user_id almost always deserve an index, since they are constantly used to filter and join.
⚠️ Indexes are not free. Every index speeds up reads but slows down writes slightly, since the database must update the index on every
INSERT,UPDATE, andDELETE. Do not index every column blindly — index the columns your slow queries actually filter on, whichEXPLAIN ANALYZEwill tell you.
-- See all existing indexes on a table
\di
-- Or specifically:
SELECT indexname, indexdef FROM pg_indexes WHERE tablename = 'orders';
☁️ AWS RDS Performance Insights — The Same Data, No Terminal Needed
Everything above works from psql. AWS RDS also gives you a visual dashboard version of the same information — no SQL required.
RDS Performance Insights dashboard — top SQL, DB load, wait events
Top SQL by load — the same information as pg_stat_statements, shown as a ranked list with a graph over time.
DB Load / Active Sessions — the same information as pg_stat_activity, shown as a live chart you can watch in real time.
Wait events — shows you what queries are waiting on: CPU, disk I/O, or locks held by other queries. This is deeper than what a simple SQL query easily shows you.
# Enable Performance Insights when creating or modifying an RDS instance
aws rds modify-db-instance \
  --db-instance-identifier your-db-name \
  --enable-performance-insights \
  --performance-insights-retention-period 7
Performance Insights is free for 7 days of retention and costs a small amount for longer retention. For any production database, this should be enabled from day one — you cannot debug a performance problem after the fact if you have no historical data.
🛠️ Hands-On Lab
# Connect to your database
psql -h your-db-host.rds.amazonaws.com -U your-user -d your-database

# Check overall database size
SELECT pg_size_pretty(pg_database_size('your_database_name'));

# List the 5 biggest tables
SELECT relname, pg_size_pretty(pg_total_relation_size(relid)) AS size
FROM pg_catalog.pg_statio_user_tables
ORDER BY pg_total_relation_size(relid) DESC LIMIT 5;

# Check active connections right now
SELECT state, COUNT(*) FROM pg_stat_activity GROUP BY state;

# Run EXPLAIN ANALYZE on a query you use often in your app
EXPLAIN ANALYZE SELECT * FROM your_table WHERE some_column = 'some_value';

# If you see "Seq Scan" and the table is large, try adding an index
CREATE INDEX idx_your_table_column ON your_table(some_column);

# Re-run the EXPLAIN ANALYZE and compare execution time
📖 Quick Reference
DevOps SQL toolkit — question to query mapping
| Question | Query |
|---|---|
| Which table is biggest? | pg_size_pretty(pg_total_relation_size(relid)) |
| Which queries are slow? | SELECT * FROM pg_stat_statements ORDER BY mean_exec_time DESC |
| How many connections open? | SELECT state, COUNT(*) FROM pg_stat_activity GROUP BY state |
| Why is this query slow? | EXPLAIN ANALYZE SELECT ... |
| Kill a hung query | SELECT pg_terminate_backend(pid) |
| Seq Scan | Checked every row — usually means a missing index |
| Index Scan | Jumped straight to matching rows — fast |
\di |
psql command — list all indexes |
| RDS Performance Insights | Visual dashboard version of all the above |
✅ What You Learned Today
✅ pg_total_relation_size() shows exactly which table is consuming disk space
✅ pg_stat_statements reveals your slowest and most frequent queries — track both metrics
✅ pg_stat_activity shows every active connection — diagnose "too many connections" errors
✅ pg_terminate_backend(pid) kills a hung query — use carefully
✅ EXPLAIN ANALYZE shows exactly how the database executes any query, with real timing
✅ "Seq Scan" means the database checked every row — usually fixable with an index
✅ "Index Scan" means the database jumped straight to matches — orders of magnitude faster
✅ Indexes speed up reads but slow down writes slightly — index based on what queries need
✅ AWS RDS Performance Insights gives you the same data visually, no SQL required
✅ Enable Performance Insights from day one on any production database
📚 References
⏭️ Up Next — Part 16: CDC & Schema Migration
You can now diagnose a slow database. Part 16 covers Change Data Capture — turning your database into a real-time event stream with Debezium — plus how to change a database schema safely using tools like Flyway and Liquibase.